
Physics, 09.01.2021 22:10 magicalunicorns47
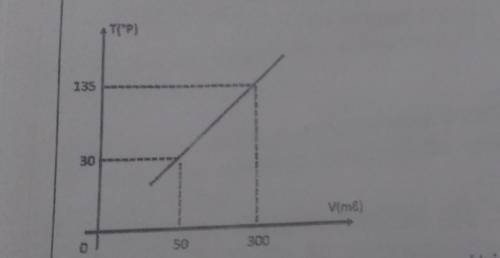
The diagram below shows the relationship between the volume v of a gas in a constant pressure gas thermometer and the corresponding temperature on an arbitrary T scale, calibrated in ° P
A) Determine the thermometric function for that device
B) Determine the temperature indicated by the device in ° P, when the gas volume is 1440ml
C) For a temperature of 1350 ° P, determine the new gas volume

Answers: 1


Other questions on the subject: Physics
Physics, 22.06.2019 12:00, jasondesatnick
Explain what happens at the saturation point when adding salt to water at room temperature.
Answers: 3
Physics, 22.06.2019 20:30, nae467
Suppose a force of 60 n is required to stretch and hold a spring 0.1 m from its equilibrium position. a. assuming the spring obeys hooke's law, find the spring constant k. b. how much work is required to compress the spring 0.5 m from its equilibrium position? c. how much work is required to stretch the spring 0.6 m from its equilibrium position? d. how much additional work is required to stretch the spring 0.1 m if it has already been stretched 0.1 m from its equilibrium? a. kequals 600
Answers: 2
Physics, 23.06.2019 02:10, Nathaliasmiles
Find the steady-state temperature at the center of the plate = /2, = /2) for sums of w from n=1 to n=19 (only odd values). find the value of n for which the change in /2, /2) is less than 1% from the value at the previous n. at this point, we consider the solution converged. does the value of the temperature at the center seem reasonable? in this part, the values of x and y are constant scalar values. you should produce a plot of the value of n on the horizontal and the estimate of the temperature at the center of the plate on the vertical. b. using the value of n (or larger) that resulted in convergence in part (a), create a contourf plot of the temperature distribution across the entire plate. use enough spatial subdivisions to create a useful plot. comment on the results. hint: you need to determine what “x” and “y” values to use to make your t matrix. i recommend using a different number of x and y values. use enough x and y values so that the plot is “smooth”.
Answers: 1
You know the right answer?
The diagram below shows the relationship between the volume v of a gas in a constant pressure gas th...
Questions in other subjects:


Mathematics, 18.07.2019 16:10
Mathematics, 18.07.2019 16:10

Medicine, 18.07.2019 16:10
Engineering, 18.07.2019 16:10


