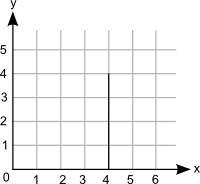
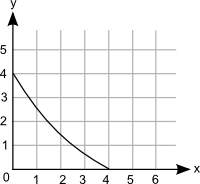
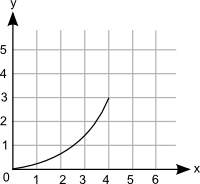
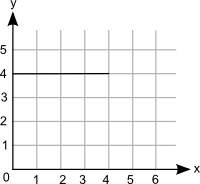
which graph best represents an increasing function?
i know what functions, slope, and all th...

Mathematics, 23.09.2019 16:00 xman839
which graph best represents an increasing function?
i know what functions, slope, and all that is but i thought that a non-linear slope was not a function, so i'm kinda confused plz me fast!

Answers: 1


Other questions on the subject: Mathematics
Mathematics, 21.06.2019 13:20, blaze9889t
Figure lmno is located at l (1, 1), m (4, 4), n (7, 1), and o (4, −2). use coordinate geometry to best classify quadrilateral lmno.
Answers: 3
Mathematics, 21.06.2019 19:30, auviannadority13
Equation for the calculation double 2 and then add 5
Answers: 1
Mathematics, 21.06.2019 21:30, cocoj3205
Amir wants to proportionally increase the size of a photo to create a poster for his room. the size of the original photo is shown. complete the statement and then answer the question to represent ways that amir can increase the size of his photo.
Answers: 2
You know the right answer?
Questions in other subjects:
Mathematics, 13.11.2020 14:00
Mathematics, 13.11.2020 14:00
Mathematics, 13.11.2020 14:00
Mathematics, 13.11.2020 14:00

Social Studies, 13.11.2020 14:00


