subject
Mathematics, 11.01.2022 05:20 zitterkoph

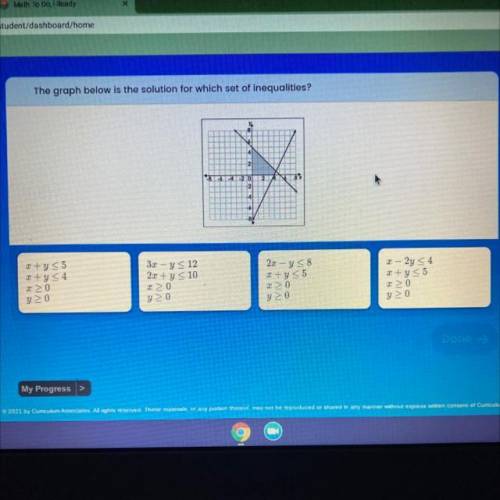
The graph below is the solution for which set of inequalities? 8
4
3 2.4 -20
2
4
5
2+y<5
2 + y < 4
>0
y20
3.x - y = 12
2.2 + y < 10
> 0
2x – y < 8
2 + y < 5
20
y > 0
2- 2y <4
+y< 5
20
y> 0
yo


The graph below is the solution for which set of inequalities?

8
4
3 2.4 -20
2
4
5
2+y<5
2 + y

ansver
Answers: 2

Other questions on the subject: Mathematics

image
Mathematics, 21.06.2019 16:30, amir6658
Arestaurant gives out a scratch-off card to every customer. the probability that a customer will win a prize from a scratch-off card is 25%. design and conduct a simulation using random numbers to find the experimental probability that a customer will need more than 3 cards in order to win a prize. justify the model for your simulation, and conduct at least 10 trials.
Answers: 1
image
Mathematics, 21.06.2019 17:40, ayoismeisalex
Which number produces a rationale number when multiplied by 1/5
Answers: 1
image
Mathematics, 21.06.2019 23:00, ambercuevas2707
Jorge wants to determine the enlarged dimensions of a digital photo to be used as wallpaper on his computer screen. the original photo was 800 pixels wide by 600 pixels high. the new photo will be 1,260 pixels wide. what will the new height be?
Answers: 1
image
Mathematics, 22.06.2019 00:50, emmaraeschool
Astudent is determining the influence of different types of food on the growth rate of spiders. she feeds one group of spiders two caterpillars twice a week. the other group received similarly-sized beetles twice a week. she records the amount of time required for individuals to reach sexual maturity. her hypothesis is that the spiders feeding on caterpillars will have a faster growth rate because caterpillars have a higher protein content compared to beetles. in this experiment, what is the dependent variable? spiders assigned to different feeding groups. time required to reach sexual maturity number of prey items fed twice a week. growth rates of each group.
Answers: 2