Two functions are shown in the table below
x f(x) g(x)
1 512 18
2 128 16
3 32 14...

Mathematics, 03.12.2021 21:20 drejones338p04p2p
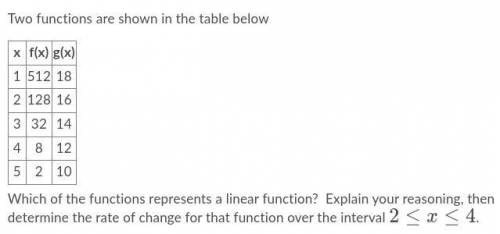
Two functions are shown in the table below
x f(x) g(x)
1 512 18
2 128 16
3 32 14
4 8 12
5 2 10
Which of the functions represents a linear function? Explain your reasoning, then determine the rate of change for that function over the interval 2≤x≤4.

Answers: 2


Other questions on the subject: Mathematics
Mathematics, 21.06.2019 22:30, hbhdnjdndj1867
The moats separating people from the animals are 5 m wide for lions and 4 m wide for the elephants. if the lion’s moat is 4 m deep, how deep should the elephants’ moat be?
Answers: 1
Mathematics, 21.06.2019 23:30, reycaden
The number of members f(x) in a local swimming club increased by 30% every year over a period of x years. the function below shows the relationship between f(x) and x: f(x) = 10(1.3)xwhich of the following graphs best represents the function? graph of f of x equals 1.3 multiplied by 10 to the power of x graph of exponential function going up from left to right in quadrant 1 through the point 0, 0 and continuing towards infinity graph of f of x equals 10 multiplied by 1.3 to the power of x graph of f of x equals 1.3 to the power of x
Answers: 1
Mathematics, 22.06.2019 02:30, dontcare7045
Find the value of x to the nearest tenth. a. 4.5 b. 5.4 c. 6.3 d. 7.2
Answers: 1
You know the right answer?
Questions in other subjects:

Mathematics, 19.03.2020 01:24


Mathematics, 19.03.2020 01:24


