
Mathematics, 04.11.2021 14:00 almasrim274
26. Use the information below to sketch a graph of
the polynomial function y = f(x). SEE EXAMPLE 4
• f(x) is positive on the intervals (−∞, −3), (−2, 0),
and (2, 3).
• f(x) is negative on the intervals (−3, −2), (0, 2),
and (3, ∞).
• f(x) is increasing on the interval (−2.67, −1)
and (1, 2.5).
• f(x) is decreasing on the intervals (−∞, −2.67),
(−1, 1), and (2.5, ∞).
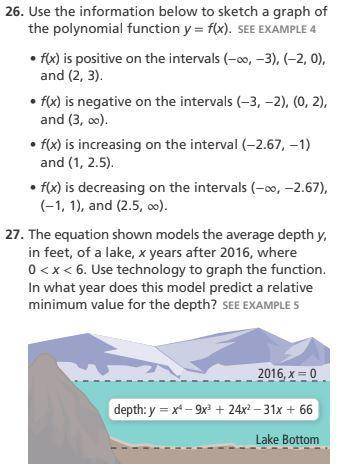
27. The equation shown models the average depth y,
in feet, of a lake, x years after 2016, where
0 < x < 6. Use technology to graph the function.
In what year does this model predict a relative
minimum value for the depth?
Depth: y = x^4 -9x^3 + 24x^2 -31x + 66

Answers: 3


Other questions on the subject: Mathematics
Mathematics, 21.06.2019 18:00, hannahchristine457
Agroup of students want to create a garden. they do not know the exact measurements but they propose using a variable to represent the length and width of the garden. the length of the garden is 10 feet longer than double the width. use a single variable to write algebraic expressions for both the length and width of the garden. write an algebraic expression for the area of the garden. use mathematical terms to describe this expression.
Answers: 3
Mathematics, 22.06.2019 00:30, citlalli30
Candice uses the function f(t)=t+100−−−−−−√ to model the number of students in her after-school program. the variable t represents days and f(t) represents the number of students. how many days does it take for there to be 15 students in her program? a. 225 days b. 125 days c. 325 days d. 115 days
Answers: 2
Mathematics, 22.06.2019 02:30, kyaslaven9791
The focus of a parabola is (-4,-5) and its directrix is y=-1 find the equation
Answers: 3
You know the right answer?
26. Use the information below to sketch a graph of
the polynomial function y = f(x). SEE EXAMPLE 4...
Questions in other subjects:


