
Mathematics, 17.10.2021 05:30 tavidallaz5988
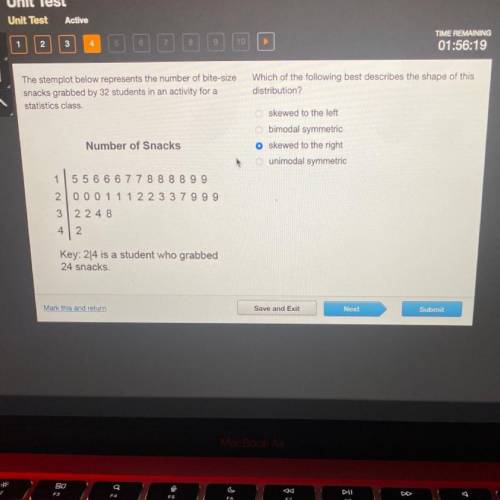
HELP!The stemplot below represents the number of bite-size
snacks grabbed by 32 students in an activity for a
statistics class.
Which of the following best describes the shape of this
distribution?
skewed to the left
Obimodal symmetric
skewed to the right
O unimodal symmetric
Number of Snacks
1 5 5 6 6 6 7 7 8 8 8 8 9 9
2000 1 1 1 2 2 3 3 7999
3 2248
4
2
Key: 24 is a student who grabbed
24 snacks.

Answers: 3


Other questions on the subject: Mathematics
Mathematics, 21.06.2019 18:30, joaquin42
Which of the statements about the graph of the function y = 2x are true? check all of the boxes that apply. the domain is all real numbers x because the exponent of 2 can be any real number when the x-values increases by 1 unit, the y-value multiplies by 2. the y-intercept is (0, 1). the graph never goes below the x-axis because powers of 2 are never negative. the range is all real numbers.
Answers: 1
Mathematics, 21.06.2019 18:40, reggie1127
Christina can paint 420 square feet in 105 minutes. which unit rate describes the scenario?
Answers: 1
Mathematics, 21.06.2019 23:30, puppylover72
Find each value of the five-number summary for this set of data. [note: type your answers as numbers. do not round.] 46, 19, 38, 27, 12, 38, 51 minimum maximum median upper quartile lower quartile
Answers: 1
You know the right answer?
HELP!The stemplot below represents the number of bite-size
snacks grabbed by 32 students in an act...
Questions in other subjects:
Mathematics, 15.02.2020 06:39


Mathematics, 15.02.2020 06:40

English, 15.02.2020 06:40
English, 15.02.2020 06:41
Mathematics, 15.02.2020 06:41
Mathematics, 15.02.2020 06:41


