
Mathematics, 24.09.2021 14:00 kennydenny4897
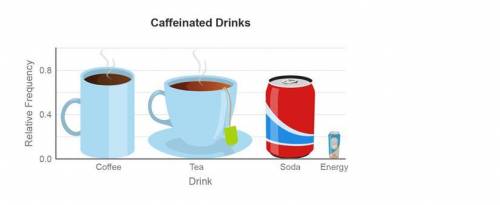
Is this graph misleading?
No, because the pictures accurately represent the percentage of each type of drink.
No, because the height of each picture corresponds to the percentage of each type of drink.
Yes, because the height of each picture does not correspond to the percentage of each type of drink.
Yes, because the areas of the pictures do not accurately represent the proportions of each type of drink.

Answers: 3


Other questions on the subject: Mathematics
Mathematics, 21.06.2019 20:30, ciannajustine
Drag the tiles to the correct boxes to complete the pairs. not all tiles will be used. match each division expression with the correct quotient.
Answers: 2
Mathematics, 21.06.2019 20:30, kingdesto3481
The function v(r)=4/3pir^3 can be used to find the volume of air inside a basketball given its radius. what does v(r) represent
Answers: 1
Mathematics, 22.06.2019 00:00, jadfavors4321
Parallelogram efgh is a rectangle. he = 6, and fe = 8. find ge: and find fj:
Answers: 1
You know the right answer?
Is this graph misleading?
No, because the pictures accurately represent the percentage of each typ...
Questions in other subjects:
Mathematics, 04.02.2021 14:00

Mathematics, 04.02.2021 14:00
Mathematics, 04.02.2021 14:00
English, 04.02.2021 14:00

Chemistry, 04.02.2021 14:00


