
Mathematics, 27.08.2021 19:30 lilly4920
PLEASE HELP ME WITH AP STATS
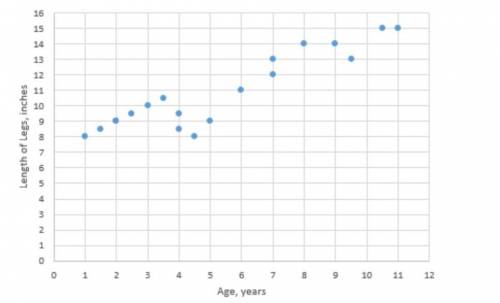
The scatterplot for age in years and length of legs is shown.
Scatterplot with the x-axis labeled age in years and the y-axis labeled length of legs in inches. The points plotted are 1 and 8, 1.5 and 8.5, 2 and 9, 2 and 9, 2.5 and 9.5, 3 and 10, 3.5 and 10.5, 4 and 9.5, 4 and 8.5, 4.5 and 8, 5 and 9, 6 and 11, 7 and 12, 7 and 13, 8 and 14, 9 and 14, 9.5 and 13, , 10.5 and 15, 11 and 15.
Part A: Estimate and interpret the correlation coefficient. (5 points)
Part B: Create an influential point for this graph that would cause the correlation to decrease. Explain your reasoning.

Answers: 3


Other questions on the subject: Mathematics
Mathematics, 21.06.2019 15:00, jazz589729
12 point are triangles pqr and stu congruent? what is the congruency that proves they are congruent? what is the perimeter of triangle pqr?
Answers: 2
Mathematics, 21.06.2019 15:40, aaliyahmaile13
Yo y do yall have 2 stars that means yall wrong bro
Answers: 1
Mathematics, 21.06.2019 18:50, khalfani0268
The number of fish in a lake can be modeled by the exponential regression equation y=14.08 x 2.08^x where x represents the year
Answers: 3
Mathematics, 21.06.2019 20:00, cferguson
Someone answer asap for ! the total ticket sales for a high school basketball game were $2,260. the ticket price for students were $2.25 less than the adult ticket price. the number of adult tickets sold was 230, and the number of student tickets sold was 180. what was the price of an adult ticket?
Answers: 1
You know the right answer?
PLEASE HELP ME WITH AP STATS
The scatterplot for age in years and length of legs is shown.
Questions in other subjects:

English, 14.10.2019 13:30

Mathematics, 14.10.2019 13:30
Mathematics, 14.10.2019 13:30

History, 14.10.2019 13:30
History, 14.10.2019 13:30
English, 14.10.2019 13:30
Mathematics, 14.10.2019 13:30


