The standard normal curve
shown here is a probability
density curve for a
continuous ra...

Mathematics, 16.06.2021 06:40 jewelia2801
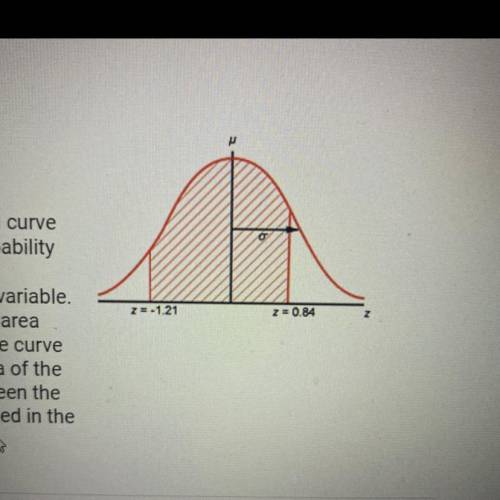
The standard normal curve
shown here is a probability
density curve for a
continuous random variable.
This means that the area
underneath the entire curve
is 1. What is the area of the
shaded region between the
two z-scores indicated in the
diagram?
A. 0.7995
B.0.6844
C.0.1151
D.0.1131
E.6864

Answers: 3


Other questions on the subject: Mathematics
Mathematics, 21.06.2019 15:00, kashishmehta917
Which statement best describes the polynomial
Answers: 2
Mathematics, 21.06.2019 17:10, ieyaalzhraa
The random variable x is the number of occurrences of an event over an interval of ten minutes. it can be assumed that the probability of an occurrence is the same in any two-time periods of an equal length. it is known that the mean number of occurrences in ten minutes is 5.3. the appropriate probability distribution for the random variable
Answers: 2
Mathematics, 21.06.2019 17:30, jessied2000
What is not true about kl and mn? what is mn? (show your work)
Answers: 1
You know the right answer?
Questions in other subjects:

Mathematics, 01.12.2020 02:10

Mathematics, 01.12.2020 02:10
Mathematics, 01.12.2020 02:10

Mathematics, 01.12.2020 02:10


