15.
.
X
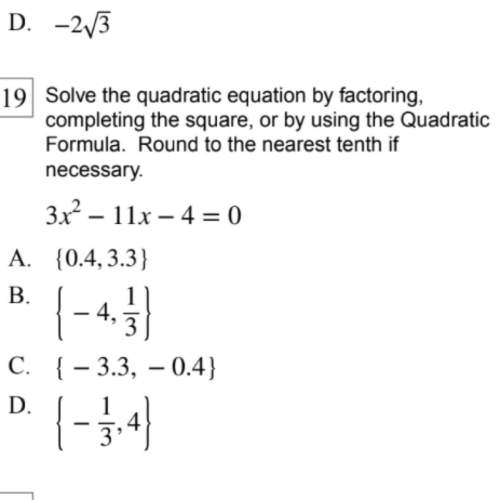
Income Earned
Which statement below accurately represents the graph?
Click on the picture to enlarge
Dollars Earned
900
BOO
700
600
500
400
300
200
100
0 1 2 3 4 5 6 7 8 9
Hours Worked
a) $100 is earned for each hour worked
b) $200 earned for every 2 hours workedis
the unit rate
+
c) $500 is earned for every 8 hours worked 0 d) $300 is earned after working 4 hours
Asif spent $745.10 on 13 new file cabinets for his office. small file cabinets cost $43.50 and large file cabinets cost $65.95. write and solve a system of equations to find the number of small cabinets and large cabinets he purchased. determine if each statement is true or false. 1. he purchased 5 small cabinets. true or false 2. he purchased 7 large cabinets. true or false 3. he spent $527.60 on large cabinets. true or false
Since opening night, attendance at play a has increased steadily, while attendance at play b first rose and then fell. equations modeling the daily attendance y at each play are shown below, where x is the number of days since opening night. on what day(s) was the attendance the same at both plays? what was the attendance? play a: y = 8x + 191 play b: y = -x^2 + 26x + 126