
Mathematics, 02.06.2021 20:40 mmaglaya1
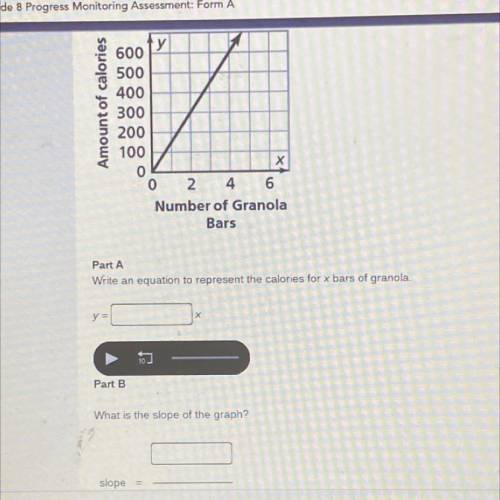
The graph shows the relationship between the number of granola bars and amount of calories per bar
Part A write an equation to represent the calories for x bars granola
Part b
What is the slope of the graph?

Answers: 1


Other questions on the subject: Mathematics
Mathematics, 21.06.2019 18:00, xojade
Assume that the weights of quarters are normally distributed with a mean of 5.67 g and a standard deviation 0.070 g. a vending machine will only accept coins weighing between 5.48 g and 5.82 g. what percentage of legal quarters will be rejected? round your answer to two decimal places.
Answers: 1
Mathematics, 22.06.2019 00:30, alimfelipe
Determine if the outside temperature is a function of the time of day or if the time of day is a function of temperature and explain why or why not.
Answers: 3
You know the right answer?
The graph shows the relationship between the number of granola bars and amount of calories per bar...
Questions in other subjects:

Mathematics, 16.04.2021 01:00

English, 16.04.2021 01:00


Mathematics, 16.04.2021 01:00


