Question Image
The graph of the exponential function f is shown on the grid below.
у
A<...

Mathematics, 02.06.2021 07:20 deedee363
Question Image
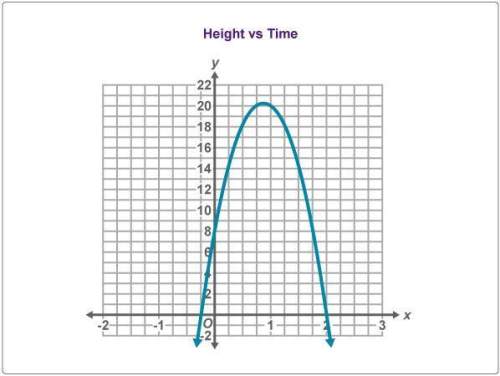
The graph of the exponential function f is shown on the grid below.
у
A
56
48
40
37
24
16
8
-7
-6
-5
-3
-1
1
2
-8
-16
-24
Which is the correct range for f?

Answers: 3


Other questions on the subject: Mathematics
Mathematics, 21.06.2019 16:20, elkinsmarie88oyzd23
What are the soultion(s) to the quadratic equation 40- x^2=0
Answers: 1
Mathematics, 21.06.2019 20:00, AleOfficial101
Hell . what are the solutions to `10x^2 - 38x - 8 = 0`? is this when i find the factors and use the numbers within the factors to determine the zeros? i hope that made sense lol
Answers: 2
Mathematics, 22.06.2019 01:00, Kikilcaro4423
First work with stencil one. use a combination of reflections, rotations, and translations to see whether stencil one will overlap with the original pattern. list the sequence of rigid transformations you used in your attempt, noting the type of transformation, the direction, the coordinates, and the displacement
Answers: 3
Mathematics, 22.06.2019 02:30, misk980
Atrain traveled for 1.5 hours to the first station, stopped for 30 minutes, then traveled for 4 hours to the final station where it stopped for 1 hour. the total distance traveled is a function of time. which graph most accurately represents this scenario? a graph is shown with the x-axis labeled time (in hours) and the y-axis labeled total distance (in miles). the line begins at the origin and moves upward for 1.5 hours. the line then continues upward at a slow rate until 2 hours. from 2 to 6 hours, the line continues quickly upward. from 6 to 7 hours, it moves downward until it touches the x-axis a graph is shown with the axis labeled time (in hours) and the y axis labeled total distance (in miles). a line is shown beginning at the origin. the line moves upward until 1.5 hours, then is a horizontal line until 2 hours. the line moves quickly upward again until 6 hours, and then is horizontal until 7 hours a graph is shown with the axis labeled time (in hours) and the y-axis labeled total distance (in miles). the line begins at the y-axis where y equals 125. it is horizontal until 1.5 hours, then moves downward until 2 hours where it touches the x-axis. the line moves upward until 6 hours and then moves downward until 7 hours where it touches the x-axis a graph is shown with the axis labeled time (in hours) and the y-axis labeled total distance (in miles). the line begins at y equals 125 and is horizontal for 1.5 hours. the line moves downward until 2 hours, then back up until 5.5 hours. the line is horizontal from 5.5 to 7 hours
Answers: 1
You know the right answer?
Questions in other subjects:
Mathematics, 25.02.2021 06:40

Law, 25.02.2021 06:40

Biology, 25.02.2021 06:40


Mathematics, 25.02.2021 06:40


