
Mathematics, 24.05.2021 03:30 Giabear23
Help!! Please!
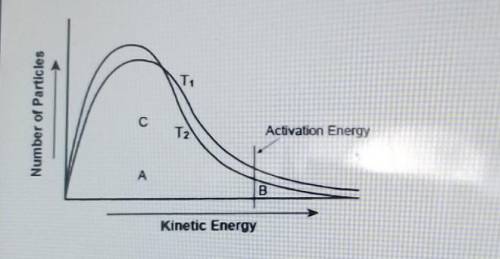
The graph shows the distribution of energy in the particles of two gas samples at different temperatures, T1 and T2. A, B, and C represent individual particles.
Based on the graph, which of the following statements is likely to be true? (3 points)
A. Particle B is more likely to participate in the reaction than particle A.
B. Particle C is more likely to participate in the reaction than particle B.
C. Most of the gas particles have either very high or very low kinetic energies.
D. More gas particles participate in the reaction at T2 than at T1.

Answers: 1


Other questions on the subject: Mathematics
Mathematics, 21.06.2019 14:30, LuxTheGirl2543
Your friend swims on the school team. in his first four races, his times are 24.7, 23.5, 25.6, and 27.2 seconds. which time listed for his next race would make the range larger?
Answers: 1
Mathematics, 21.06.2019 15:30, ayoismeisalex
Kylie explained that (-4x+9)^2 will result in a difference of squares because (-4x+9)^2 (-4x+9)^2 =(-4x)^2+(9)^2=16x^2+81
Answers: 3
You know the right answer?
Help!! Please!
The graph shows the distribution of energy in the particles of two gas samples at di...
Questions in other subjects:


History, 14.05.2021 05:50


Mathematics, 14.05.2021 05:50
Mathematics, 14.05.2021 05:50


