
Mathematics, 28.04.2021 18:30 Ostritch8336
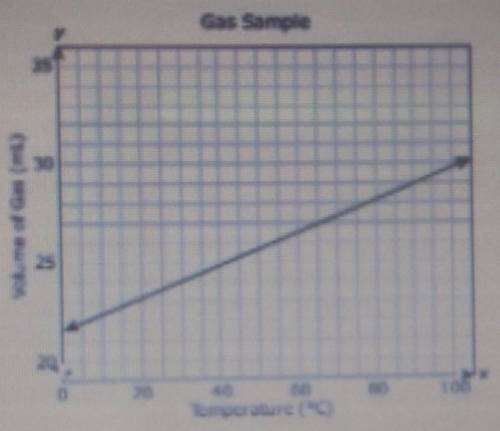
The graph shows how the volume of a gas sample changes as the temperature changes and the pressure remains constant.
Which of these best represents the rate of change in the volume of the gas sample with respect to the temperature?
A. 7/100 mL/°C
B. 1/12 mL/°C
C. 12 mL/°C
D. 22+2/5 mL°C

Answers: 3


Other questions on the subject: Mathematics
Mathematics, 21.06.2019 17:30, andrewjschoon2876
Which equation represents a line that is parallel to the line whose equation is 3x-2y=7( show all work)
Answers: 3
Mathematics, 21.06.2019 19:00, hanahspeers
If f(x)= sqrt4x+9+2, which inequality can be used to find the domain of f(x)?
Answers: 2
Mathematics, 21.06.2019 19:20, sierravick123owr441
Ab and bc form a right angle at point b. if a= (-3,-1) and b= (4,4) what is the equation of bc?
Answers: 1
You know the right answer?
The graph shows how the volume of a gas sample changes as the temperature changes and the pressure r...
Questions in other subjects:


Mathematics, 14.12.2020 20:50


