
Mathematics, 29.08.2019 18:30 AleciaCassidy
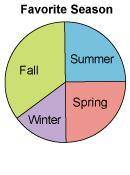
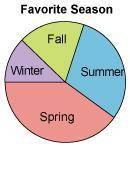
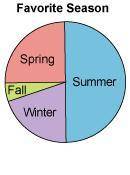
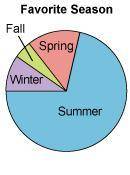
Michael surveyed 40 of his friends to determine their favorite season. his data shows that 70% said summer, 10% said winter, 5% said fall, and the rest said spring. what circle graph best represents michael's data? circle graph with unequal sections. sections from smallest to largest are labeled winter, spring, summer, and fall. the sections for spring and summer sections are equal in size. circle graph with unequal sections. sections from smallest to largest are labeled winter, fall, summer, and spring. circle graph with unequal sections. sections from smallest to largest are labeled fall, winter, spring, and summer. circle graph with unequal sections. sections from smallest to largest are labeled fall, winter, spring, summer.

Answers: 1


Other questions on the subject: Mathematics
Mathematics, 21.06.2019 18:00, vianney84
1. a parachutist is 800 feet above the ground when she opens her parachute. she then falls at a constant rate of 5 feet per second. select the equation that represents this situation. h = -800t + 5 y = -5x + 800 h = 5t - 800 y = 800x + 5 i need
Answers: 1
Mathematics, 21.06.2019 19:30, viodsenpai
John checked his watch and said that it is thursday, 7 am. what will the day and time be 2006 hours plzzz i will give you 100 points
Answers: 1
You know the right answer?
Michael surveyed 40 of his friends to determine their favorite season. his data shows that 70% said...
Questions in other subjects:

Mathematics, 24.09.2019 16:00

History, 24.09.2019 16:00
Mathematics, 24.09.2019 16:10


Social Studies, 24.09.2019 16:10
Mathematics, 24.09.2019 16:10


