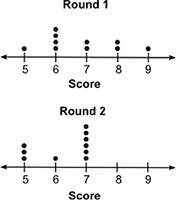
The dot plots below show the scores for a group of students who took two rounds of a quiz:
w...

Mathematics, 29.08.2019 23:30 jjackson0010
The dot plots below show the scores for a group of students who took two rounds of a quiz:
which of the following inferences can be made using the dot plot?
a. there is no overlap between the data.
b. round 1 scores were lower than round 2 scores.
c. round 2 scores were higher than round 1 scores.
d. the range of round 1 is greater than the round 2 range.

Answers: 1


Other questions on the subject: Mathematics
Mathematics, 21.06.2019 15:30, shikiaanthony
What is the value of y? round to the nearest tenth
Answers: 2
Mathematics, 22.06.2019 00:00, notashley1703
Write the equation in general quadratic form: plz !
Answers: 1
Mathematics, 22.06.2019 01:10, journeyburks07
What is the angle measure, or angle of depression, between this bird and the bird watcher?
Answers: 1
Mathematics, 22.06.2019 03:00, Santos7446
In a class of 77, there are 44 students who play soccer. if the teacher chooses 33 students, what is the probability that none of the three of them play soccer?
Answers: 2
You know the right answer?
Questions in other subjects:


Mathematics, 05.09.2019 16:10


