
Mathematics, 14.10.2019 15:10 isaacchan
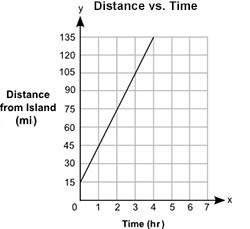
The graph shows the distance, y, in miles, of a moving motorboat from an island for a certain amount of time, x, in hours:
what is the speed of the motorboat?
30 miles per hour
45 miles per hour
15 miles per hour
135 miles per hour

Answers: 2


Other questions on the subject: Mathematics
Mathematics, 21.06.2019 23:30, jdenty3398
The graph of the the function f(x) is given below. find [tex]\lim_{x \to 0\zero} f(x)[/tex] [tex]\lim_{x \to 1+\oneplus} f(x)[/tex] [tex]\lim_{x \to 0-\zeroneg} f(x)[/tex]
Answers: 1
Mathematics, 22.06.2019 01:40, Conner5459
Astandard deck of cards contains 52 cards. one card is selected from the deck. (a) compute the probability of randomly selecting a diamond or heart. (type an integer or a decimal rounded to three decimal places as needed.) (b) compute the probability of randomly selecting a diamond or heart or club. (type an integer or a decimal rounded to three decimal places as needed.) (c) compute the probability of randomly selecting queen or club. (type an integer or a decimal rounded to three decimal places as needed.)
Answers: 2
Mathematics, 22.06.2019 01:40, tinamarie04ts
Agroup of student volunteers participates in a study designed to assess several behavioral interventions for improving output in a repetitive task. prior to the beginning of the study, all volunteers unknowingly observed, and their output is measured. at the beginning of the study, prior to any intervention, the volunteers perform the same task under the observation of a study administrator, and their overall output increases. which of the following terms describes this phenomenon? a. simpson's paradox b. hawthorne effect are d. novelty effect d. pygmalion effect e. observer-expectancy effect
Answers: 1
You know the right answer?
The graph shows the distance, y, in miles, of a moving motorboat from an island for a certain amount...
Questions in other subjects:
Mathematics, 12.10.2019 07:10


Biology, 12.10.2019 07:10
Biology, 12.10.2019 07:10


French, 12.10.2019 07:10


