
Business, 12.10.2019 07:10 KingKayyy9177
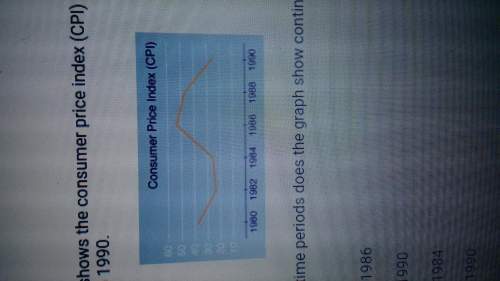
The following graph shows the consumer price index (cpi) for a fictional country from 1980 to 1990
for which of these time periods does the graph show continuous deflation
a) 1982 - 1986
b) 1980 - 1990
c) 1982 - 1984
d) 1988 - 1990

Answers: 2


Other questions on the subject: Business
Business, 22.06.2019 13:30, ayoismeisalex
On january 2, well co. purchased 10% of rea, inc.’s outstanding common shares for $400,000, which equaled the carrying amount and the fair value of the interest purchased in rea’s net assets. well did not elect the fair value option. because well is the largest single shareholder in rea, and well’s officers are a majority on rea’s board of directors, well exercises significant influence over rea. rea reported net income of $500,000 for the year and paid dividends of $150,000. in its december 31 balance sheet, what amount should well report as investment in rea?
Answers: 3
Business, 22.06.2019 14:00, ujusdied5176
Which of the following would not generally be a motive for a firm to hold inventories? a. to decouple or separate parts of the production process b. to provide a stock of goods that will provide a selection for customers c. to take advantage of quantity discounts d. to minimize holding costs e. all of the above are functions of inventory.
Answers: 1
Business, 22.06.2019 20:50, lopez5628
Many potential buyers value high-quality used cars at the full-information market price of € p1 and lemons at € p2. a limited number of potential sellers value high-quality cars at € v1 ≤ p1 and lemons at € v2 ≤ p2. everyone is risk neutral. the share of lemons among all the used cars that might be potentially sold is € θ . suppose that the buyers incur a transaction cost of $200 to purchase a car. this transaction cost is the value of their time to find a car. what is the equilibrium? is it possible that no cars are sold
Answers: 2
Business, 22.06.2019 21:00, neylabaker7489
In a transportation minimization problem, the negative improvement index associated with a cell indicates that reallocating units to that cell would lower costs. truefalse
Answers: 1
You know the right answer?
The following graph shows the consumer price index (cpi) for a fictional country from 1980 to 1990
Questions in other subjects:


