
Mathematics, 20.01.2020 11:31 phebusadrian01
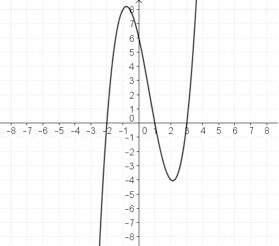
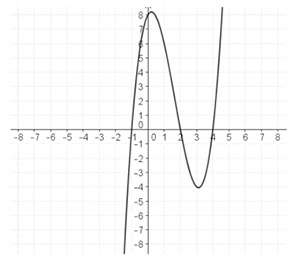
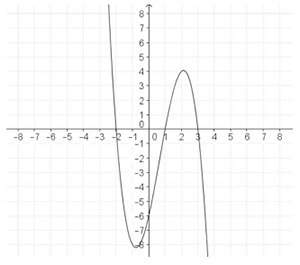
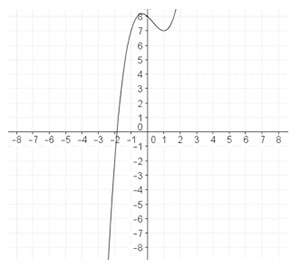
Which of the graphs below represent the function f(x) = x3 - 5x2 + 2x + 8? you may sketch the graph to compare.

Answers: 3


Other questions on the subject: Mathematics
Mathematics, 21.06.2019 19:30, apere655
Ascientist wants to use a model to present the results of his detailed scientific investigation. why would a model be useful? a )because the model makes the concepts easier to understand b) because the model is easy to put together and to use c) because the model prevents other scientists from asking questions d) because the model requires the audience to pay full attention to it i don't know what to choose because between a and d a is much more likely than d because it only wants to get the attention of the audience. i'm confuse.
Answers: 1
Mathematics, 21.06.2019 20:30, amandaaaa13
Asmall business produces and sells balls. the fixed costs are $20 and each ball costs $4.32 to produce. each ball sells for $8.32. write the equations for the total cost, c, and the revenue, r, then use the graphing method to determine how many balls must be sold to break even.
Answers: 1
Mathematics, 21.06.2019 21:00, candicecorvette
Check all that apply. f is a function. f is a one-to-one function. c is a function. c is a one-to-one function.
Answers: 3
Mathematics, 22.06.2019 02:40, lorenialopez1234
The graph shows a vertical translation of y= square root of x cubedwhat is the range of the translated function? {yly < 0}{yly > 0}{yly is a natural number}{yly is a real number}
Answers: 3
You know the right answer?
Which of the graphs below represent the function f(x) = x3 - 5x2 + 2x + 8? you may sketch the graph...
Questions in other subjects:


Computers and Technology, 07.01.2020 00:31
Computers and Technology, 07.01.2020 00:31
Mathematics, 07.01.2020 00:31


