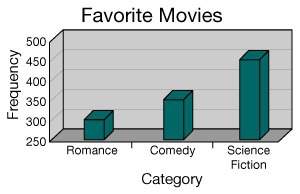
Choose the most accurate statement based on the graph shown.
the graph is a good represe...

Mathematics, 06.10.2019 10:01 delgadillogiselle711
Choose the most accurate statement based on the graph shown.
the graph is a good representation of the data.
the graph is misleading because it uses 3-dimensional bars.
the graph is misleading because the vertical range is too small creating the impression that differences are greater than they actually are.

Answers: 2


Other questions on the subject: Mathematics
Mathematics, 21.06.2019 15:10, ineemorehelp
Can (2,3 and square root 10) be sides ona right triangle?
Answers: 1
Mathematics, 21.06.2019 17:30, bazsinghnagoke
What is the number 321,000,000 in scientific notation? also what is the number? ?
Answers: 2
Mathematics, 21.06.2019 22:00, haleysmith8608
In dire need~! describe how to use area models to find the quotient 2/3 divided by 1/5. check your work by also finding the quotient 2/3 divided by 1/5 using numerical operations only.
Answers: 1
You know the right answer?
Questions in other subjects:

Law, 05.11.2020 08:00

History, 05.11.2020 08:00

Chemistry, 05.11.2020 08:00

World Languages, 05.11.2020 08:00
Mathematics, 05.11.2020 08:00
Mathematics, 05.11.2020 08:00
Mathematics, 05.11.2020 08:00

Social Studies, 05.11.2020 08:00


