
Mathematics, 31.03.2021 03:10 morrisjillian23
What type of linear association does the graph show?
A scatterplot with a line of best fit drawn in. The line goes up from left to right. There are 7 dots that follow the general path of the line, but are not very close to the line.
Strong positive
Weak positive
Strong negative
Weak negative

Answers: 3


Other questions on the subject: Mathematics
Mathematics, 21.06.2019 20:00, GreatBaconGamer
Solve for x and y a x= 13.3 y= 16.7 b x= 23.3 y= 12.5 c x= 7.5 y= 16.7 d x=7.5 y= 12.5
Answers: 1
Mathematics, 22.06.2019 02:00, jzoda7318
The line plot below represents the number of letters written to overseas pen pals by the students at the waverly middle school. each x represents 10 students. how many students wrote more than 6 and fewer than 20 letters. a.250 b.240 c.230 d.220
Answers: 3
Mathematics, 22.06.2019 04:00, jaylynomalley
In a fruit survey, 300 children choose their favorite fruit out of apples, bananas, and watermelon. 150 chose apples and 90 chose bananas. what percent chose watermelon?
Answers: 1
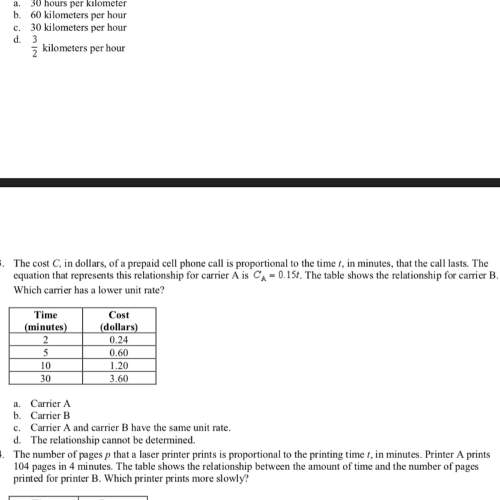
You know the right answer?
What type of linear association does the graph show?
A scatterplot with a line of best fit drawn in...
Questions in other subjects:


