
Mathematics, 18.03.2021 16:40 tatia65
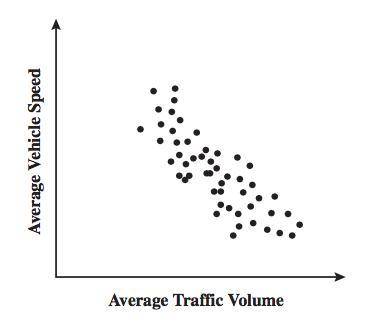
The scatter plot below shows the average traffic volume and average vehicle speed on a certain freeway for 50 days in 1999.
Which statement best describes the relationship between average traffic volume and average vehicle speed shown on the scatter plot?
As traffic volume increases, vehicle speed increases at first, then decreases.
As traffic volume increases, vehicle speed decreases at first, then increases.
As traffic volume increases, vehicle speed increases.
As traffic volume increases, vehicle speed decreases

Answers: 1


Other questions on the subject: Mathematics
Mathematics, 21.06.2019 15:30, superstarsara5ouh83x
Write an equation of a line in slope intercept form that is perpendicular to the line 2x -3y = 12 and passes through the point (2, 6).
Answers: 3
Mathematics, 21.06.2019 16:20, bestballer7095
Aclass consists of 55% boys and 45% girls. it is observed that 25% of the class are boys and scored an a on the test, and 35% of the class are girls and scored an a on the test. if a student is chosen at random and is found to be a girl, the probability that the student scored an ais
Answers: 2
You know the right answer?
The scatter plot below shows the average traffic volume and average vehicle speed on a certain freew...
Questions in other subjects:


Health, 28.02.2020 01:52


