HELP PLZZZ
An equivalent ratio to the tape diagram shown is __ to __.
A:
8
...

Mathematics, 18.03.2021 14:00 mrashrafkotkaat
HELP PLZZZ
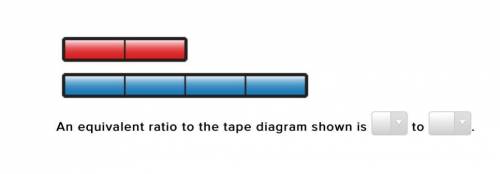
An equivalent ratio to the tape diagram shown is __ to __.
A:
8
9
7
B:
20
16
17

Answers: 2


Other questions on the subject: Mathematics
Mathematics, 21.06.2019 16:00, choyontareq
The step function g(x) is defined as shown. what is the range of g(x)? ***answer choices in picture.
Answers: 3
Mathematics, 22.06.2019 01:30, jude40
Asample of 200 rom computer chips was selected on each of 30 consecutive days, and the number of nonconforming chips on each day was as follows: the data has been given so that it can be copied into r as a vector. non. conforming = c(10, 15, 21, 19, 34, 16, 5, 24, 8, 21, 32, 14, 14, 19, 18, 20, 12, 23, 10, 19, 20, 18, 13, 26, 33, 14, 12, 21, 12, 27) #construct a p chart by using the following code. you will need to enter your values for pbar, lcl and ucl. pbar = lcl = ucl = plot(non. conforming/200, ylim = c(0,.5)) abline(h = pbar, lty = 2) abline(h = lcl, lty = 3) abline(h = ucl, lty = 3)
Answers: 3
Mathematics, 22.06.2019 02:00, albattatasraap5wymy
An amusement park manager determined that about 23 of all customers would wait in long lines to ride the new roller coaster. which simulation could not be used to answer questions about whether a customer would wait?
Answers: 1
You know the right answer?
Questions in other subjects:


