The table gives information
about the speeds of 68 cars.
Speed (s mph) Frequency
0 <...

Mathematics, 05.03.2021 21:20 tiwaribianca475
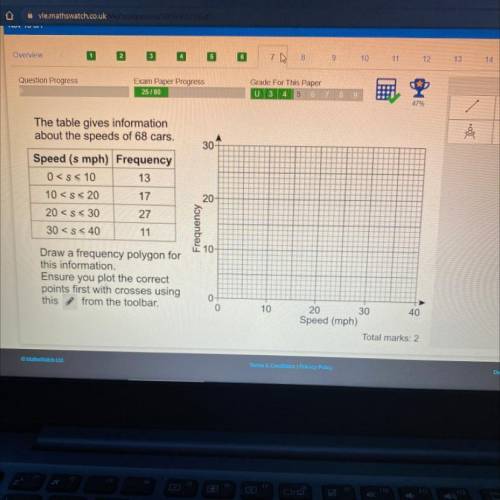
The table gives information
about the speeds of 68 cars.
Speed (s mph) Frequency
0 < s < 10 13
10 < s < 20 17
20 < s < 30 27
30 < s < 40. 11
Draw a frequency polygon for
this information.
Ensure you plot the correct
points first with crosses using
this from the toolbar.

Answers: 1


Other questions on the subject: Mathematics
Mathematics, 21.06.2019 19:30, johndiaz26
Solve the following inequalities and show the solution on a number line. 2x+3< 3(4x+5)
Answers: 1
Mathematics, 21.06.2019 22:30, azainababbas
Which statement shows that 6.24 is a rational number? a. 6.24 = 6.242424 b. 6.24 = 6.24 c. 6.24 = 68⁄33 d. 6.24 = 66⁄25
Answers: 1
You know the right answer?
Questions in other subjects:

English, 28.10.2020 14:00
English, 28.10.2020 14:00


Mathematics, 28.10.2020 14:00
Mathematics, 28.10.2020 14:00

Health, 28.10.2020 14:00


