Mathematics, 05.03.2021 06:20 pal23
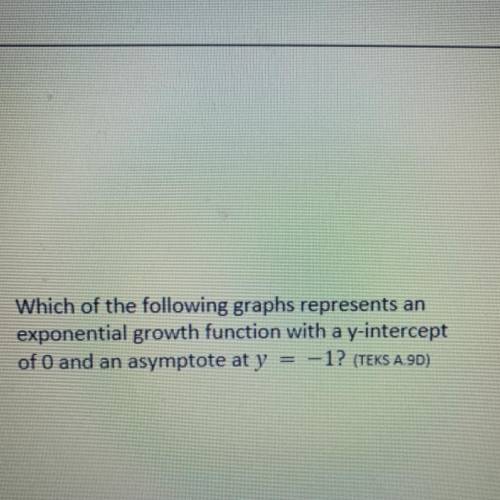
5. Which of the following graphs represents an
exponential growth function with a y-intercept
of O and an asymptote at y = –1? (TEKS A.9D)


Answers: 3


Other questions on the subject: Mathematics

Mathematics, 20.06.2019 18:02, laequity7325
The average human heart beats 72 beats per minute. how many times does it beat in 15 seconds?
Answers: 1

Mathematics, 21.06.2019 13:00, geraldsmith2008
He expression 2(l + w) is used to calculate the perimeter of a rectangle, where l is length and w is width. if the length is fraction 2 over 3 unit and the width is fraction 1 over 3 unit, what is the perimeter of the rectangle in units? fraction 2 over 3 unit 1 unit 1fraction 2 over 3 units 2 units
Answers: 3


Mathematics, 21.06.2019 15:50, tylerwayneparks
(08.01)consider the following pair of equations: x + y = −2 y = 2x + 10 if the two equations are graphed, at what point do the lines representing the two equations intersect? (−4, 2) (4, 2) (−2, 4) (2, 4)
Answers: 2
You know the right answer?
5. Which of the following graphs represents an
exponential growth function with a y-intercept
...
...
Questions in other subjects:

Chemistry, 03.02.2020 09:43


Mathematics, 03.02.2020 09:43


Social Studies, 03.02.2020 09:43


English, 03.02.2020 09:44

Mathematics, 03.02.2020 09:44

Social Studies, 03.02.2020 09:44


