Mathematics, 01.03.2021 07:50 anilauferc
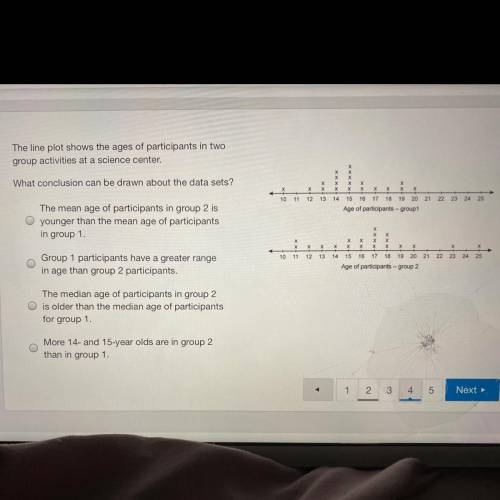
The line plot shows the ages of participants in two
group activities at a science center.
What conclusion can be drawn about the data sets?
X
X
х
х
х
X
x
х
19 20 21
10
11
12
13
14
15
16 17
18
22 23
24
25
Age of participants-group1
The mean age of participants in group 2 is
younger than the mean age of participants
in group 1.
x
х
x
x
х
х
х
х
х
х
X
х
Х
12
x
19
х
20 21
10
11
13
14
15
16
17 18
22
23 24
25
Group 1 participants have a greater range
in age than group 2 participants.
Age of participants - group 2
The median age of participants in group 2
is older than the median age of participants
for group 1.
More 14- and 15-year olds are in group 2
than in group 1.


Answers: 1


Other questions on the subject: Mathematics


You know the right answer?
The line plot shows the ages of participants in two
group activities at a science center.
Wha...
Wha...
Questions in other subjects:

Mathematics, 15.07.2020 01:01


Mathematics, 15.07.2020 01:01


