The table gives some information
about the heights of 60 boys.
Least height
Greatest he...

Mathematics, 22.02.2021 14:00 madyson304
The table gives some information
about the heights of 60 boys.
Least height
Greatest height
Lower quartile
Upper quartile
Median
142 cm
181 cm
149 cm
160 cm
156 cm
a) Complete the boxplot for this information,
130 140 150 160 170 180
(3)
height (cm)
b) Work out an estimate for the number of these boys with a height between
149 cm and 181 cm.
2.

Answers: 1


Other questions on the subject: Mathematics

Mathematics, 21.06.2019 13:30, carlalopezelox9533
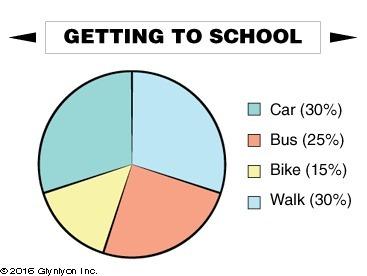
Patel’s class voted on their favorite color. patel plans to make a circle graph to display the results. which statements are true about the circle graph patel can create? check all that apply.
Answers: 2

Mathematics, 21.06.2019 19:30, tiwaribianca475
Cor d? ? me ? max recorded the heights of 500 male humans. he found that the heights were normally distributed around a mean of 177 centimeters. which statements about max’s data must be true? a) the median of max’s data is 250 b) more than half of the data points max recorded were 177 centimeters. c) a data point chosen at random is as likely to be above the mean as it is to be below the mean. d) every height within three standard deviations of the mean is equally likely to be chosen if a data point is selected at random.
Answers: 1

Mathematics, 21.06.2019 21:30, GOOBER3838
80 points suppose marcy made 45 posts online. if 23 of them contained an image, what percent of her posts had images? round your answer to the nearest whole percent. 54 percent 51 percent 49 percent 48 percent
Answers: 2
You know the right answer?
Questions in other subjects:

Mathematics, 05.05.2020 10:46

Mathematics, 05.05.2020 10:46


Mathematics, 05.05.2020 10:46

History, 05.05.2020 10:46


Mathematics, 05.05.2020 10:46


