
Mathematics, 01.02.2021 18:10 Dweath50
PLEASE HELP
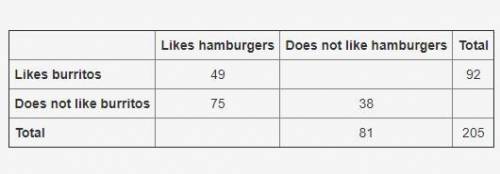
A food truck did a daily survey of customers to find their food preferences. The data is partially entered in the frequency table. Complete the table to analyze the data and answer the questions:
Likes hamburgers Does not like hamburgers Total
Likes burritos 49 92
Does not like burritos 75 38
Total 81 205
Part A: What percentage of the survey respondents do not like both hamburgers and burritos? (2 points)
Part B: What is the marginal relative frequency of all customers that like hamburgers? (3 points)
Part C: Use the conditional relative frequencies to determine which data point has strongest association of its two factors. Use complete sentences to explain your answer. (5 points)

Answers: 1


Other questions on the subject: Mathematics
Mathematics, 21.06.2019 17:00, faithcalhoun
Acylinder has volume 45π and radius 3. what is it’s height?
Answers: 2
Mathematics, 21.06.2019 18:00, milagrosee12
Me, the vertices of quadrilateral coat are c(2,0), o(7,0), a(7,2) and t(2,2). prove that coat is a rectangle.
Answers: 3
You know the right answer?
PLEASE HELP
A food truck did a daily survey of customers to find their food preferences. The data i...
Questions in other subjects:

Social Studies, 09.07.2019 04:00


History, 09.07.2019 04:00
Social Studies, 09.07.2019 04:00

Arts, 09.07.2019 04:00


Mathematics, 09.07.2019 04:00


