
Mathematics, 18.01.2021 08:10 dnarioproctor
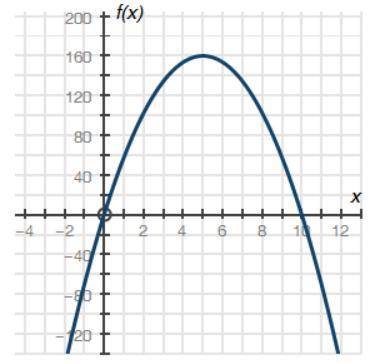
The graph below shows a company's profit f(x), in dollars, depending on the price of pencils x, in dollars, sold by the company:
Graph of quadratic function f of x having x intercepts at ordered pairs negative 0, 0 and 10, 0. The vertex is at 5, 160.
Part A: What do the x-intercepts and maximum value of the graph represent? What are the intervals where the function is increasing and decreasing, and what do they represent about the sale and profit?
Part B: What is an approximate average rate of change of the graph from x = 2 to x = 5, and what does this rate represent?
Part C: Describe the constraints of the domain.

Answers: 2


Other questions on the subject: Mathematics
Mathematics, 21.06.2019 19:30, taylor511176
Celeste wants to have her hair cut and permed and also go to lunch. she knows she will need $50. the perm cost twice as much as her haircut and she needs $5 for lunch. how much does the perm cost?
Answers: 1
Mathematics, 21.06.2019 22:00, huangjianhe135
The difference of two numbers is 40. find the numbers if 0.3 parts of one number is equal to 37.5% of the other one.
Answers: 1
Mathematics, 21.06.2019 22:10, goodygoodgirlygirl
Akitchen is 12 ft. by 14 ft. with 10 ft. high walls. how much would it cost to put vinyl flooring in this room? $8.80 per ft
Answers: 1
You know the right answer?
The graph below shows a company's profit f(x), in dollars, depending on the price of pencils x, in d...
Questions in other subjects:

Spanish, 10.10.2019 05:00


English, 10.10.2019 05:00

Mathematics, 10.10.2019 05:00


