Help please?
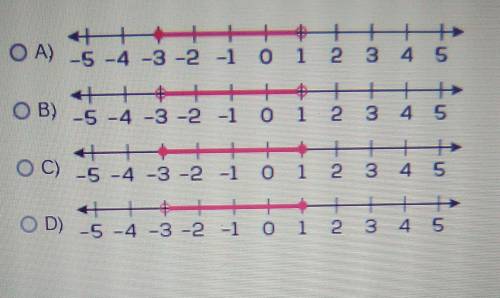
Which graph represents the solutions to -3 ≤ x < 1?
...

Mathematics, 11.01.2021 20:20 mariss8152
Help please?
Which graph represents the solutions to -3 ≤ x < 1?

Answers: 1


Other questions on the subject: Mathematics
Mathematics, 21.06.2019 20:00, cielo2761
The table below represents a linear function f(x) and the equation represents a function g(x): x f(x) −1 −5 0 −1 1 3 g(x) g(x) = 2x − 7 part a: write a sentence to compare the slope of the two functions and show the steps you used to determine the slope of f(x) and g(x). (6 points) part b: which function has a greater y-intercept? justify your answer. (4 points)
Answers: 2
Mathematics, 21.06.2019 21:00, arizmendiivan713
*let m∠cob = 50°30’, m∠aob = 70° and m∠aoc = 20°30’. could point c be in the interior of ∠aob? why?
Answers: 1
Mathematics, 21.06.2019 22:30, carltonwashington23
Julie was able to walk 16 km through the zoo in 6 hours. how long will it take her to walk 24 km through the zoo?
Answers: 2
Mathematics, 21.06.2019 22:50, zitterkoph
Listed below are time intervals (min) between eruptions of a geyser. assume that the "recent" times are within the past few years, the "past" times are from around 20 years ago, and that the two samples are independent simple random samples selected from normally distributed populations. do not assume that the population standard deviations are equal. does it appear that the mean time interval has changed? is the conclusion affected by whether the significance level is 0.10 or 0.01? recent 78 90 90 79 57 101 62 87 71 87 81 84 57 80 74 103 62 past 88 89 93 94 65 85 85 92 87 91 89 91 follow the steps of hypothesis testing, including identifying the alternative and null hypothesis, calculating the test statistic, finding the p-value, and making a conclusions about the null hypothesis and a final conclusion that addresses the original claim. use a significance level of 0.10. is the conclusion affected by whether the significance level is 0.10 or 0.01? answer choices below: a) yes, the conclusion is affected by the significance level because h0 is rejected when the significance level is 0.01 but is not rejected when the significance level is 0.10. b) no, the conclusion is not affected by the significance level because h0 is not rejected regardless of whether a significance level of 0.10 or 0.01 is used. c) yes, the conclusion is affected by the significance level because h0 is rejected when the significance level is 0.10 but is not rejected when the significance level is 0.01. d) no, the conclusion is not affected by the significance level because h0 is rejected regardless of whether a significance level of 0.10 or 0.01 is used.
Answers: 3
You know the right answer?
Questions in other subjects:

Biology, 03.03.2020 17:22

History, 03.03.2020 17:23

Mathematics, 03.03.2020 17:24


