
Mathematics, 07.01.2021 21:20 cooboy
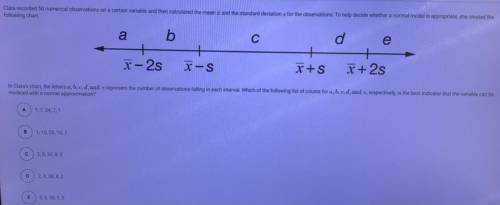
Clara recorded 50 numerical observations on a certain variable and then calculated the mean and the standard deviations for the observations. To help decide whether a normal model is appropriate, she created the
following chart
a
b
с
d
e
X-2s
X-S
X+S
X + 2s
In Clara's chart, the letters a, b, c, d, and c represent the number of observations falling in each interval. Which of the following list of counts for a, b, c, d, and e, respectively, is the best indicator that the variable can be
modeled with a normal approximation?
А
1.7,34,7,1
1,10,28, 10,1
С
2,8, 30, 8,2
D
2, 4, 38, 4,2
E
5,5, 30,5,5

Answers: 3


Other questions on the subject: Mathematics
Mathematics, 21.06.2019 21:30, isamilo520
Consider a bag that contains 220 coins of which 6 are rare indian pennies. for the given pair of events a and b, complete parts (a) and (b) below. a: when one of the 220 coins is randomly selected, it is one of the 6 indian pennies. b: when another one of the 220 coins is randomly selected (with replacement), it is also one of the 6 indian pennies. a. determine whether events a and b are independent or dependent. b. find p(a and b), the probability that events a and b both occur.
Answers: 2
Mathematics, 22.06.2019 02:30, sariahieveryone
Ablue whale traveled 3112 miles in 214hours. what was the whale's rate in yards per hour? (1 mile = 1,760 yards)
Answers: 1
You know the right answer?
Clara recorded 50 numerical observations on a certain variable and then calculated the mean and the...
Questions in other subjects:


History, 12.07.2019 02:30

Biology, 12.07.2019 02:30
Biology, 12.07.2019 02:30

Social Studies, 12.07.2019 02:30


