Mathematics, 06.01.2021 06:00 Kurlyash
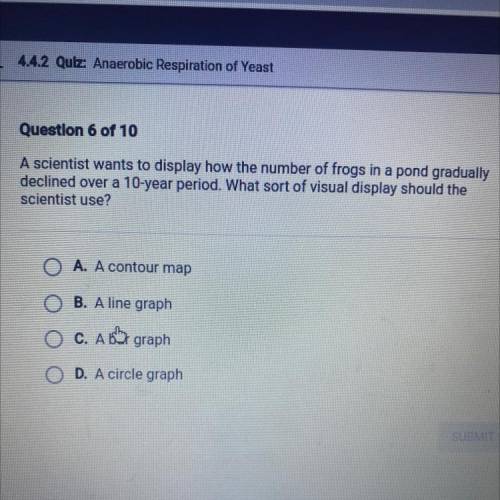
A scientist wants to display how the number of frogs in a pond gradually
declined over a 10-year period. What sort of visual display should the
scientist use?
A. A contour map
B. A line graph
C. A bar graph
D. A circle graph


Answers: 1


Other questions on the subject: Mathematics


Mathematics, 21.06.2019 22:50, sarbjit879
Which linear inequality is represented by the graph?
Answers: 1

Mathematics, 22.06.2019 01:00, vanenav2003ovf1lz
Drag statements and reasons to each row to show why the slope of the line between d and e is the same as the slope between e and f, given that triangles a and b are similar.
Answers: 2
You know the right answer?
A scientist wants to display how the number of frogs in a pond gradually
declined over a 10-year pe...
Questions in other subjects:


Mathematics, 12.07.2019 21:00

History, 12.07.2019 21:00

History, 12.07.2019 21:00


Advanced Placement (AP), 12.07.2019 21:00


