
Mathematics, 05.01.2021 23:00 lenaeeee
(05.01)
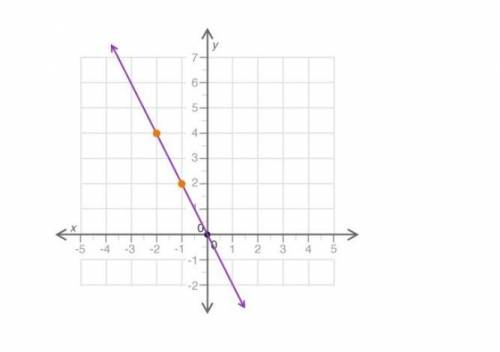
Which statement best explains if the graph correctly represents the proportional relationship y = −2x?
A coordinate plane is shown. Points are graphed at 2 comma 4 and negative 1 comma 2. The points are joined by a line.
No, the points shown would not be part of y = −2x
No, proportions cannot be represented on a graph
Yes, all proportions can be shown on a graph of this line
Yes, the points shown on the line would be part of y = −2x

Answers: 1


Other questions on the subject: Mathematics
Mathematics, 20.06.2019 18:04, mtunes
Drag each scenario to show whether the final result will be greater than the original value, less than the original value, or the same as the original value. 1. a 25% decrease followed by a 50% increase 2. a 20% decrease followed by a 25% increase
Answers: 3
Mathematics, 21.06.2019 15:30, nicpinela1234
The coordinates of a, b, and c in the diagram are a(p,4), b(6,1), and c(9,q). which equation correctly relates p and q? hint: since is perpendicular to , the slope of × the slope of = -1. a. p - q = 7 b. q - p = 7 c. -q - p = 7 d. p + q = 7
Answers: 3
Mathematics, 21.06.2019 17:30, sarahhfaithhh
One line passes through (-7,-4) and (5,4) . another line passes through the point (-4,6) and (6,-9)
Answers: 1
Mathematics, 21.06.2019 19:30, ruddymorales1123
If y varies directly as x2 and y=6 when x=6, find the constant of variation.
Answers: 2
You know the right answer?
(05.01)
Which statement best explains if the graph correctly represents the proportional relationsh...
Questions in other subjects:

Mathematics, 06.05.2020 23:10


