
Mathematics, 14.12.2020 21:00 pennygillbert
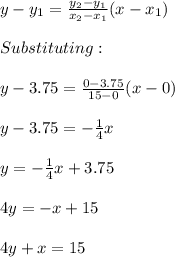
The graph below shows the solution to a system of inequalities: Solid line joining ordered pairs 0, 3.75 and 15, 0. Shade the portion of the graph above the line in the first and second quadrant Which of the following inequalities is modeled by the graph? (5 points) Group of answer choices x + 4y ≥ 15; y ≥ 0 x − 4y ≥ 15; y ≥ 0 x + 4y ≤ 15; y ≥ 0 −x − 4y ≥ 15; y ≥ 0

Answers: 2


Other questions on the subject: Mathematics
Mathematics, 21.06.2019 17:30, mduncan840
The marriott family bought a new apartment three years ago for $65,000. the apartment is now worth $86,515. assuming a steady rate of growth, what was the yearly rate of appreciation? what is the percent of the yearly rate of appreciation?
Answers: 1
Mathematics, 22.06.2019 01:30, OinkFred
20 points for the answer. this is for real , don't put random ! a rectangle has a length of 4 centimeters and a width of 7 centimeters. what is the effect on the perimeter when the dimensions are multiplied by 5? the perimeter is increased by a factor of 5. the perimeter is increased by a factor of 20. the perimeter is increased by a factor of 25. the perimeter is increased by a factor of 100.
Answers: 2
You know the right answer?
The graph below shows the solution to a system of inequalities: Solid line joining ordered pairs 0,...
Questions in other subjects:
Mathematics, 14.04.2020 22:50
Mathematics, 14.04.2020 22:50
Mathematics, 14.04.2020 22:50

History, 14.04.2020 22:50


