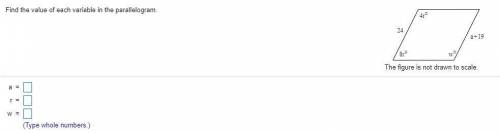
Find the value of each variable in the parallelogram.
And please answer in text, no imag...

Mathematics, 12.12.2020 16:40 madiiiiiii69
Find the value of each variable in the parallelogram.
And please answer in text, no images.

Answers: 2


Other questions on the subject: Mathematics
Mathematics, 21.06.2019 23:00, tonimgreen17p6vqjq
Which graph represents the linear function below? y-3=1/2(x+2)
Answers: 2
Mathematics, 22.06.2019 00:30, braydenmcd02
Hi i’m not sure how to do question 20 if u could explain how to do it that’d b great
Answers: 1
Mathematics, 22.06.2019 00:30, JosefineRubino2204
Which of the following represents a function? 50 !
Answers: 1
Mathematics, 22.06.2019 01:20, blackboy21
1. why is a frequency distribution useful? it allows researchers to see the "shape" of the data. it tells researchers how often the mean occurs in a set of data. it can visually identify the mean. it ignores outliers. 2. the is defined by its mean and standard deviation alone. normal distribution frequency distribution median distribution marginal distribution 3. approximately % of the data in a given sample falls within three standard deviations of the mean if it is normally distributed. 95 68 34 99 4. a data set is said to be if the mean of the data is greater than the median of the data. normally distributed frequency distributed right-skewed left-skewed
Answers: 2
You know the right answer?
Questions in other subjects:

History, 30.11.2021 20:50

Chemistry, 30.11.2021 20:50
Mathematics, 30.11.2021 20:50

Mathematics, 30.11.2021 20:50
History, 30.11.2021 20:50


