
Mathematics, 04.02.2020 19:49 doggielover36
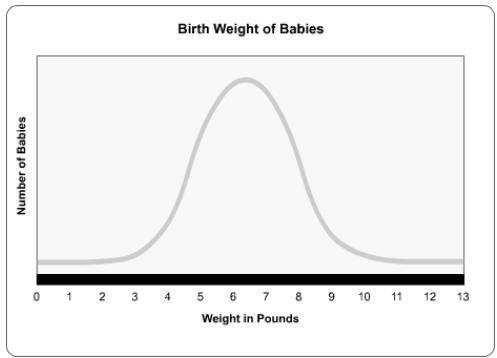
This graph shows the variation in birth weights in a specific population of humans. use the graph data to answer the question.
which statement describes the variation of birth weights in this population?
a.) there is no variation in birth weight.
b.) there is a moderate variation in birth weight.
c.) variation changes over time.

Answers: 3


Other questions on the subject: Mathematics
Mathematics, 21.06.2019 16:40, kristenhernandez74
Which region represents the solution to the given system of inequalities? |-0.5x+y23 | 1.5x+ys-1 5 4 -3 -2 -1 1 2 3 4
Answers: 1
Mathematics, 21.06.2019 21:00, hastephens03
Mr. thompson is on a diet. he currently weighs 260 pounds. he loses 4 pounds per month. what part of the story makes the relationship not proportional?
Answers: 3
Mathematics, 21.06.2019 22:30, gunnatvinson
If a line is defined by the equation y = 5x + 2, what is the slope?
Answers: 2
You know the right answer?
This graph shows the variation in birth weights in a specific population of humans. use the graph da...
Questions in other subjects:

History, 29.06.2019 20:30

History, 29.06.2019 20:30


