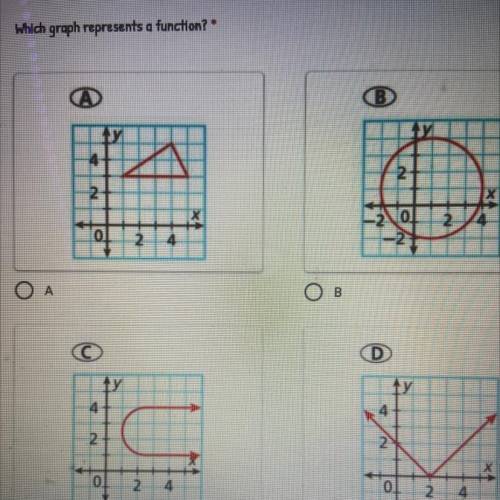
Which graph represents a function?
...

Mathematics, 08.12.2020 20:50 igobeastmode
Which graph represents a function?

Answers: 2


Other questions on the subject: Mathematics
Mathematics, 21.06.2019 17:00, samantha9430
The magnitude, m, of an earthquake is defined to be m=log l/s, where i is the intensity of the earthquake (measured by the amplitude of the seismograph wave) and s is the intensity of a “standard” earthquake, which is barely detectable. what is the magnitude of an earthquake that is 1,000 times more intense than a standard earthquake? use a calculator. round your answer to the nearest tenth.
Answers: 1
Mathematics, 21.06.2019 17:30, scoutbuffy2512
How do you use the elimination method for this question? explain, because i really want to understand!
Answers: 1
Mathematics, 21.06.2019 19:30, kklove6700
What is the result of adding the system of equations? 2x+y=4 3x-y=6
Answers: 2
Mathematics, 21.06.2019 22:00, zakiyahjones0890
If rs 900 amounts to rs 1044 in 4 years, what sum will amount to 1368 in 3 1/2 years at the same rate
Answers: 3
You know the right answer?
Questions in other subjects:

French, 03.03.2021 14:00
Mathematics, 03.03.2021 14:00

Social Studies, 03.03.2021 14:00


Mathematics, 03.03.2021 14:00
English, 03.03.2021 14:00


