(7.44) The graph below shows the relationship
between the number of dollars a worker earns
an...

Mathematics, 08.12.2020 01:10 zaylencollins55
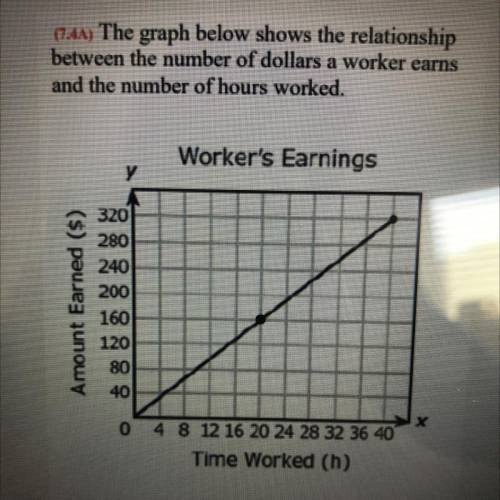
(7.44) The graph below shows the relationship
between the number of dollars a worker earns
and the number of hours worked.

Answers: 1


Other questions on the subject: Mathematics
Mathematics, 21.06.2019 13:00, enorton
Harry’s soccer team plays 2 nonconference games for every 3 games that they play against conference opponents. if y represents the number of nonconference games and x represents the number of conference games, which equation best models this proportional relationship? a)y=2/3 x b)y=3/2 x c)y = 2x d)y = 6x
Answers: 1
Mathematics, 21.06.2019 20:40, alemvp8219
Reduce fractions expressing probability to lowest terms. in 3,000 repetitions of an experiment, a random event occurred in 500 cases. the expected probability of this event is?
Answers: 3
You know the right answer?
Questions in other subjects:

Spanish, 07.10.2019 23:00


Computers and Technology, 07.10.2019 23:00

Social Studies, 07.10.2019 23:00
Mathematics, 07.10.2019 23:00


