
Mathematics, 03.12.2020 18:00 mucciak9414
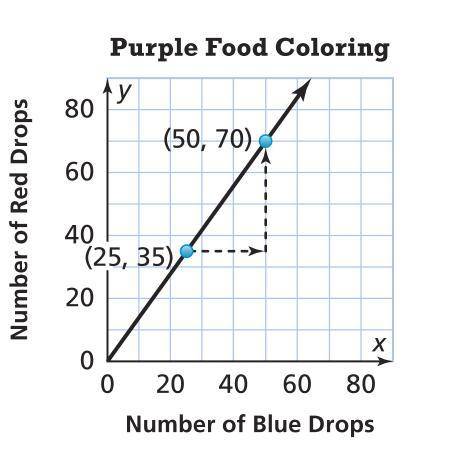
The graph shows the proportions of red and blue food coloring that Taylor mixes to make the purple frosting. What is the slope of the line? Tell what it means in the problem situation. The graph is ( 50, 70 ) ( 25, 35 )

Answers: 1


Other questions on the subject: Mathematics
Mathematics, 21.06.2019 14:00, james234886
An animal shelter has 21 puppies. if the puppies are 28% of the total dog and cat population , how many dogs and cats are in the animal shelter
Answers: 1
You know the right answer?
The graph shows the proportions of red and blue food coloring that Taylor mixes to make the purple f...
Questions in other subjects:


Mathematics, 29.11.2020 19:40


History, 29.11.2020 19:40


