Using the mileage chart below, find the distance between Sturgis and Hot
Springs
Hot Springs<...

Mathematics, 29.11.2020 01:10 alyxxboothe
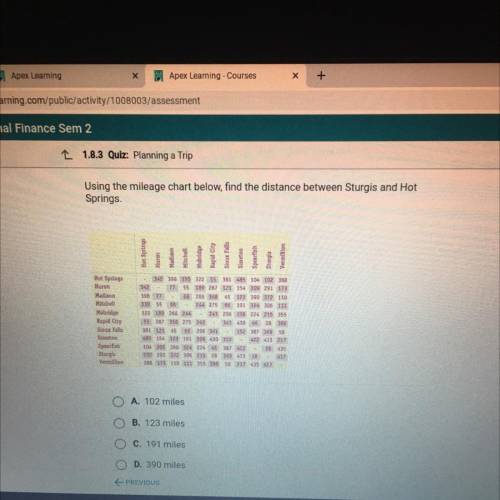
Using the mileage chart below, find the distance between Sturgis and Hot
Springs
Hot Springs
Vermillion
Mobridge
Sioux Falls
Sisseton
Spearfish
Sturgis
% Madison
28 Mitchell
& Rapid City
344 430 26 28 386
152 387 36956
422 413 217
18 434
412
388 173 110 111 355 356 56 217 435 417
Hi

Answers: 3


Other questions on the subject: Mathematics
Mathematics, 21.06.2019 18:00, burnsmykala23
Solve this system of equations. 12x − 18y = 27 4x − 6y = 10
Answers: 1
Mathematics, 22.06.2019 02:00, GreenHerbz206
1.3.4 practice : modeling: solving linear equations in this assignment, you may work alone, with a partner, or in a small group. discuss the results of your work and/or any lingering questions with your teacher. your assignment: road trip you're taking a scenic road trip down ca-highway 1 from san jose, california, to los angeles. you plan to split the drive into two days, stopping for one night. choose one town to stop in, and find the driving distance for the second day. 1. circle the town you chose to stop in. (1 point) santa barbara: an image of palm trees san luis obispo: an image of a church 2. why did you choose this town? (1 point) 3.what do you know? .what do you want to find out? .what kind of answer do you expect? define the variable. 4. what is the variable x for this problem? (1 point) write the equation. 5. write an equation showing that the distance traveled on the first day plus the distance traveled on the second day is equal to 425 miles. (4 points: 2 points for each side of the equation) isolate the variable. 6. what inverse operation do you need to perform on both sides to isolate x in the equation? (2 points: 1 point for the correct number, 1 point for the correct operation) solve the equation. 7. solve the equation for x. interpret the answer in terms of the problem. (2 points: 1 point for the solution, 1 point for the interpretation) check your solution. 8. to confirm that your answer is correct, add the two days' distances. this should equal the total distance from san jose to los angeles. show your work as an equation. (3 points: 1 point for the setup, 2 points for the correct answer)
Answers: 3
You know the right answer?
Questions in other subjects:

Mathematics, 19.10.2020 05:01

Mathematics, 19.10.2020 05:01
Mathematics, 19.10.2020 05:01

Physics, 19.10.2020 05:01

Biology, 19.10.2020 05:01


