
PLEASE HELP !!
Part A
Describe a relationship that can be modeled by the function represente...

Mathematics, 19.10.2020 05:01 20dyeaubn
PLEASE HELP !!
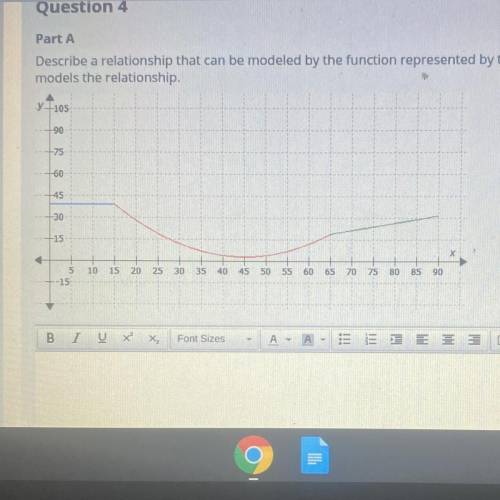
Part A
Describe a relationship that can be modeled by the function represented by the graph ,and explain how the function models the relationship.
Part B
Identify and interpret the key features of the function in the context of the situation you described in part A .

Answers: 2


Other questions on the subject: Mathematics
Mathematics, 21.06.2019 17:10, ivilkas23
The frequency table shows a set of data collected by a doctor for adult patients who were diagnosed with a strain of influenza. patients with influenza age range number of sick patients 25 to 29 30 to 34 35 to 39 40 to 45 which dot plot could represent the same data as the frequency table? patients with flu
Answers: 2
Mathematics, 21.06.2019 21:00, latinotimo7643
With both problems. a. s.a. p directions on photo ^
Answers: 1
You know the right answer?
Questions in other subjects:

History, 09.12.2020 22:30

Mathematics, 09.12.2020 22:30

English, 09.12.2020 22:30

Social Studies, 09.12.2020 22:30
Mathematics, 09.12.2020 22:30
Mathematics, 09.12.2020 22:30


