
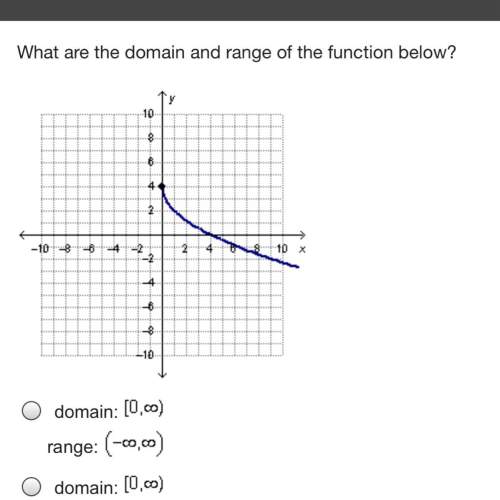
Mathematics, 28.11.2020 18:30 des2962
I can create and use a graph to predict values and justify my results? Help me with this please I would appreciate it


Answers: 2


Other questions on the subject: Mathematics
Mathematics, 21.06.2019 16:00, ringo12384
You eat 8 strawberries and your friend eats 12 strawberries from a bowl. there are 20 strawberries left. which equation and solution give the original number of strawberries?
Answers: 1
Mathematics, 21.06.2019 19:30, gsVKJCGAISGF46661
Complete the solution of the equation. find the value of y when x equals to 6 4x+y=20
Answers: 2
Mathematics, 21.06.2019 20:30, alexialiles19
Max recorded the heights of 500 male humans. he found that the heights were normally distributed around a mean of 177 centimeters. which statements about max’s data must be true? a) the median of max’s data is 250 b) more than half of the data points max recorded were 177 centimeters. c) a data point chosen at random is as likely to be above the mean as it is to be below the mean. d) every height within three standard deviations of the mean is equally likely to be chosen if a data point is selected at random.
Answers: 2
You know the right answer?
I can create and use a graph to predict values and justify my results? Help me with this please I wo...
Questions in other subjects:
Mathematics, 03.10.2019 03:00


