Need help please!
A proportional relationship is shown in the table below:
x: 0, 1.3, 2.6, 3....

Mathematics, 20.10.2020 04:01 michelerin9486
Need help please!
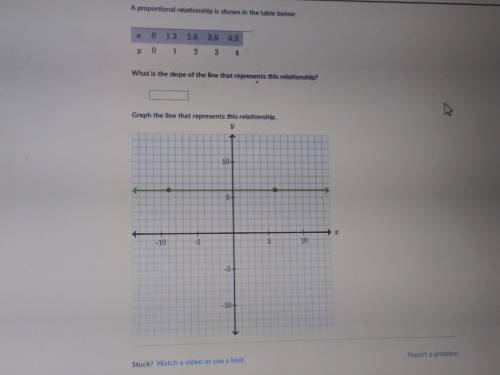
A proportional relationship is shown in the table below:
x: 0, 1.3, 2.6, 3.9, 5.2
y: 0, 1, 2, 3, 4
What is the slope of the line that represents this relationship? [ ]
Graph the line that represents this relationship.

Answers: 2


Other questions on the subject: Mathematics
Mathematics, 21.06.2019 19:30, bakaoffire
Mr. brettler is hanging up a 5-foot tall rectangular welcome sign in the gym. he has drawn a sketch on a coordinate grid. he has the lower vertices of the sign at (9, –3) and (–6, –3). where would the upper vertices be on the grid?
Answers: 1
Mathematics, 21.06.2019 22:00, ashhleyjohnson
After a dreary day of rain, the sun peeks through the clouds and a rainbow forms. you notice the rainbow is the shape of a parabola. the equation for this parabola is y = -x2 + 36. graph of a parabola opening down at the vertex 0 comma 36 crossing the x–axis at negative 6 comma 0 and 6 comma 0. in the distance, an airplane is taking off. as it ascends during take-off, it makes a slanted line that cuts through the rainbow at two points. create a table of at least four values for the function that includes two points of intersection between the airplane and the rainbow. analyze the two functions. answer the following reflection questions in complete sentences. what is the domain and range of the rainbow? explain what the domain and range represent. do all of the values make sense in this situation? why or why not? what are the x- and y-intercepts of the rainbow? explain what each intercept represents. is the linear function you created with your table positive or negative? explain. what are the solutions or solution to the system of equations created? explain what it or they represent. create your own piecewise function with at least two functions. explain, using complete sentences, the steps for graphing the function. graph the function by hand or using a graphing software of your choice (remember to submit the graph).
Answers: 2
Mathematics, 21.06.2019 22:10, ava789
Find the volume of the solid whose base is the region bounded by f(x), g(x) and the x-axis on the interval [0, 1], and whose cross-sections perpendicular to the y-axis are squares. your work must show the integral, but you may use your calculator to evaluate it. give 3 decimal places for your answe
Answers: 3
Mathematics, 21.06.2019 22:30, lamooothegoat
The pair of coordinates that do not represent the point( 5,150’) is a. (5,-210) b. (5,210) c. (-5,330) d. (-5,-30)
Answers: 1
You know the right answer?
Questions in other subjects:
Mathematics, 01.09.2019 08:30


History, 01.09.2019 08:30

Arts, 01.09.2019 08:30

Health, 01.09.2019 08:30

English, 01.09.2019 08:30


