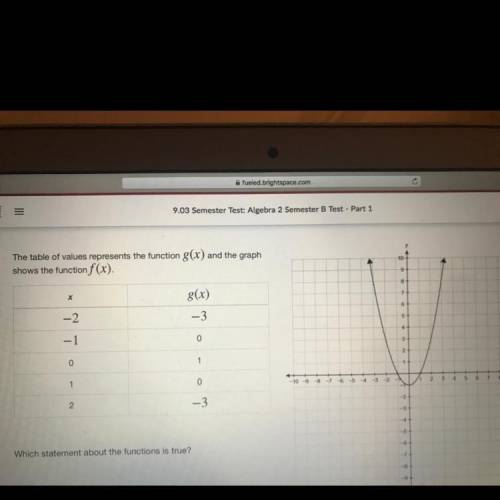
The table of values represents the function g(x) and the graph
shows the function f(x).
...

Mathematics, 17.10.2020 14:01 ella3714
The table of values represents the function g(x) and the graph
shows the function f(x).
Which statement about the functions is true?
The x-intercepts of f(x) are common to those of
g(x).
o f(x) and g(x) intersect at exactly two points.
f(x) and g(x) have the same y-intercept.
The minimum value of f(x) is less than the minimum
value of g(x).

Answers: 2


Other questions on the subject: Mathematics
Mathematics, 21.06.2019 16:40, chrisraptorofficial
14 pointslet x be the seats in the small van and y the seats in the large van. how many seats does the large van have? a company uses two vans to transport worker from a free parking lot to the workplace between 7: 00 and 9: 00a. m. one van has 9 more seats than the other. the smaller van makes two trips every morning while the larger one makes only one trip. the two vans can transport 69 people, maximum. how many seats does the larger van have?
Answers: 1
Mathematics, 21.06.2019 19:40, lylah42
The krasnapolski is a top-of-the-line hotel in amsterdam, the netherlands. among their many services, they rent bicycles to guests. the bicycle checkout is open 24 hours per day 7 days per week and has 50 bicycles on hand. on average, 10 guests request a bicycle each day, arriving completely randomly at all times of the day during the spring and summer seasons. guests keep bicycles for four days on average, with a standard deviation of two days. how long does a guest on average have to wait for a bike? a. approximately 24 hours b. approximately 0.033 hours c. approximately 4 days d. approximately 47 minutes
Answers: 3
Mathematics, 21.06.2019 23:30, jdenty3398
The graph of the the function f(x) is given below. find [tex]\lim_{x \to 0\zero} f(x)[/tex] [tex]\lim_{x \to 1+\oneplus} f(x)[/tex] [tex]\lim_{x \to 0-\zeroneg} f(x)[/tex]
Answers: 1
You know the right answer?
Questions in other subjects:
Mathematics, 24.11.2020 19:30

History, 24.11.2020 19:30
History, 24.11.2020 19:30

Social Studies, 24.11.2020 19:30

English, 24.11.2020 19:30


Chemistry, 24.11.2020 19:30


