
Mathematics, 24.11.2020 19:30 jaimes04
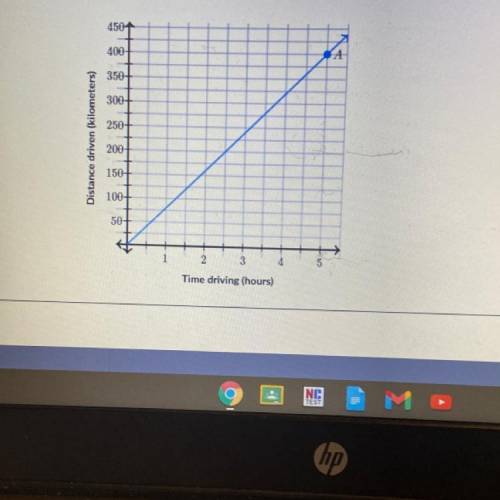
The proportional relationship between the distance driven and amount of time driving is shown in the following graph
A. The y-coordinate of point A represents the distance driven in 4 hours
B. The distance driven in 1 hour is 80 km.
C. None of the about

Answers: 2


Other questions on the subject: Mathematics
Mathematics, 21.06.2019 19:10, gurlnerd
1jessica's home town is a mid-sized city experiencing a decline in population. the following graph models the estimated population if the decline continues at the same rate. select the most appropriate unit for the measure of time that the graph represents. a. years b. hours c. days d. weeks
Answers: 2
Mathematics, 21.06.2019 20:00, hlannette7005
Segment an is an altitude of right δabc with a right angle at a. if ab = 2, squared 5 in and nc = 1 in, find bn, an, ac.
Answers: 2
Mathematics, 21.06.2019 22:30, yettionajetti
In order to be invited to tutoring or extension activities a students performance 20 point higher or lower than average for the
Answers: 1
You know the right answer?
The proportional relationship between the distance driven and amount of time driving is shown in the...
Questions in other subjects:


Mathematics, 30.07.2019 04:30


History, 30.07.2019 04:30
History, 30.07.2019 04:30
Mathematics, 30.07.2019 04:30


