
Mathematics, 13.07.2020 22:01 donavery24
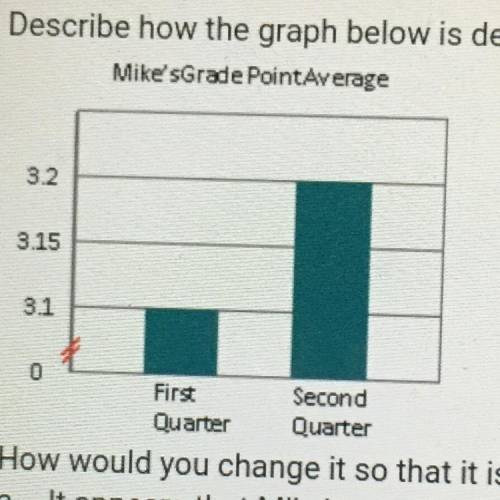
Describe how the graph below is deceptive.
How would you change it so that it is not misleading?
A. It appears that Mike's grade point average for the second quarter is 3 times his first quarter
average. Change the intervals on the vertical scale so they are consistent.
b. It appears that Mike's grade point average for the second quarter was significantly larger than
his first quarter average. Change the width of the bars to display the correct scale.
c. It appears that Mike's grade point average for the second quarter is 2 times his first quarter
average. Change the intervals on the horizontal scale so they are consistent.
d. There is no way to change the graph so it is not misleading.

Answers: 1


Other questions on the subject: Mathematics
Mathematics, 21.06.2019 17:00, 19youngr
You are on a cycling trip around europe with friends. you check the weather forecast for the first week. these are the temperatures for the week. sun mon tues wed thurs fri sat 16°c 20°c 24°c 28°c 28°c 23°c 15°c what is the mean temperature forecast for the week?
Answers: 1
Mathematics, 21.06.2019 17:00, charitysamuels
Can someone pls ! pls answer all. no explanation needed..
Answers: 1
Mathematics, 21.06.2019 22:40, winterblanco
Use this graph to find the cost of 6 show tickets
Answers: 1
You know the right answer?
Describe how the graph below is deceptive.
How would you change it so that it is not misleading?
Questions in other subjects:


Mathematics, 06.12.2019 21:31


