
Mathematics, 07.07.2020 08:01 slim2077
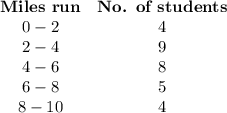
Use the raw data below to create a table that can be used to create a histogram with 5
classes. Assume the data is the miles ran by students in our class.
{3.5, 2.7, 1.6, 2.9, 1.7, 5.3, 7.5, 8.2, 4.6, 1.3,
4.7, 9.4, 7.6, 3.9, 3.2, 8.1, 4.9, 5.7, 2.6, 3.2,
6.5, 4.8, 3.5, 4.8, 9.2, 4.9, 1.1, 2, 6.4, 7.1}
Define the Number of Classes we need for our histogram.
We will have
classes. We will have classes

Answers: 1


Other questions on the subject: Mathematics
Mathematics, 21.06.2019 16:30, chintiffany4779
The perimeter of a triangle is 69 cm. the first is 5 cm shorter than the second side. the third side is twice as long the first side. find the length of each side
Answers: 1
Mathematics, 21.06.2019 17:50, AdanNava699
Find the cosine function that is represented in the graph.
Answers: 1
You know the right answer?
Use the raw data below to create a table that can be used to create a histogram with 5
classes. Ass...
Questions in other subjects:
Mathematics, 08.09.2020 21:01


History, 08.09.2020 21:01
Mathematics, 08.09.2020 21:01
Mathematics, 08.09.2020 21:01


