
Mathematics, 05.07.2020 16:01 whisperyang
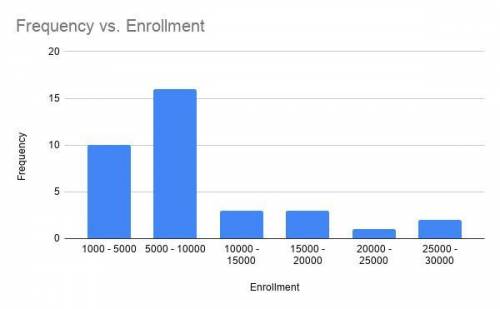
A survey of enrollment at 35 community colleges across the United States yielded the following figures:
6414; 1550; 2109; 9350; 21828; 4300; 5944; 5722; 2825; 2044; 5481; 5200; 5853; 2750; 10012; 6357; 27000; 9414; 7681; 3200; 17500; 9200; 7380; 18314; 6557; 13713; 17768; 7493; 2771; 2861; 1263; 7285; 28165; 5080; 11622
a. Organize the data into a chart with five intervals of equal width. Label the two columns "Enrollment" and "Frequency."
b. Construct a histogram of the data.
c. If you were to build a new community college, which piece of information would be more valuable: the mode or the mean?
d. Calculate the sample mean.
e. Calculate the sample standard deviation.
f. A school with an enrollment of 8000 would be how many standard deviations away from the mean?

Answers: 2


Other questions on the subject: Mathematics
Mathematics, 22.06.2019 00:00, AnonymousLizard52303
The probability that a tutor will see 0, 1, 2, 3, or 4 students is given below determine the probability distribution's missing value.
Answers: 1
You know the right answer?
A survey of enrollment at 35 community colleges across the United States yielded the following figur...
Questions in other subjects:
Mathematics, 24.09.2019 17:50

Biology, 24.09.2019 17:50
SAT, 24.09.2019 17:50

Social Studies, 24.09.2019 17:50

History, 24.09.2019 17:50
Mathematics, 24.09.2019 17:50


