
Mathematics, 24.06.2020 02:01 beverlyamya
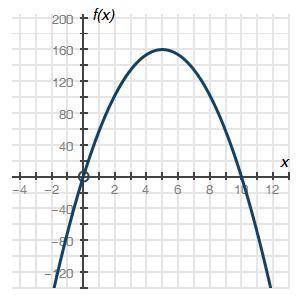
The graph below shows a company's profit f(x), in dollars, depending on the price of pencils x, in dollars, sold by the company: Graph of quadratic function f of x having x intercepts at ordered pairs negative 0, 0 and 10, 0. The vertex is at 5, 160. Part A: What do the x-intercepts and maximum value of the graph represent? What are the intervals where the function is increasing and decreasing, and what do they represent about the sale and profit? (4 points) Part B: What is an approximate average rate of change of the graph from x = 2 to x = 5, and what does this rate represent? (3 points) Part C: Describe the constraints of the domain. (3 points)

Answers: 1


Other questions on the subject: Mathematics
Mathematics, 21.06.2019 18:30, AgentPangolin
If, while training for a marathon, you ran 60 miles in 2/3 months, how many miles did you run each month? (assume you ran the same amount each month) write your answer as a whole number, proper fraction, or mixed number in simplest form. you ran __ miles each month.
Answers: 1
Mathematics, 21.06.2019 20:00, marisolrojo2002
Which expression is equivalent to -5(3x - 6/7)
Answers: 1
You know the right answer?
The graph below shows a company's profit f(x), in dollars, depending on the price of pencils x, in d...
Questions in other subjects:

Biology, 19.07.2019 13:00
Mathematics, 19.07.2019 13:00
Biology, 19.07.2019 13:00
Biology, 19.07.2019 13:00
Mathematics, 19.07.2019 13:00
Biology, 19.07.2019 13:00


Social Studies, 19.07.2019 13:00


