
Mathematics, 24.04.2020 19:55 Huntruh2842
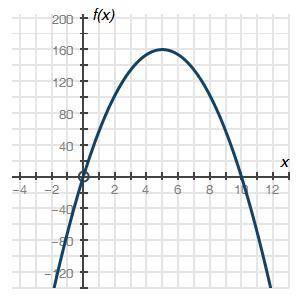
The graph below shows a company's profit f(x), in dollars, depending on the price of pencils x, in dollars, sold by the company:
Graph of quadratic function f of x having x intercepts at ordered pairs negative 0, 0 and 10, 0. The vertex is at 5, 160.
Part A: What do the x-intercepts and maximum value of the graph represent? What are the intervals where the function is increasing and decreasing, and what do they represent about the sale and profit? (4 points)
Part B: What is an approximate average rate of change of the graph from x = 2 to x = 5, and what does this rate represent? (3 points)
Part C: Describe the constraints of the domain. (3 points)

Answers: 3


Other questions on the subject: Mathematics
Mathematics, 21.06.2019 21:00, sjackson0625p8w1a0
Me! i will mark you brainliest if you are right and show your i don't get polynomials and all the other stuff. multiply and simplify.2x(^2)y(^3)z(^2) · 4xy(^4)x(^2)show your
Answers: 2
Mathematics, 21.06.2019 23:40, aureliafung2p7cxoo
Mikes car gets an average of 28 mpg. there are 12 gallons of fuel in mikes car when he starts his trip of 140 miles. about how many gallons are left at the end of his trip?
Answers: 1
Mathematics, 22.06.2019 00:00, destinywashere101
Last week jason walked 3 1/4 miles each day for 3 days and 4 5/8 miles each day for 4 days. about how many miles did jason walk last week?
Answers: 1
You know the right answer?
The graph below shows a company's profit f(x), in dollars, depending on the price of pencils x, in d...
Questions in other subjects:


Chemistry, 21.10.2020 01:01


English, 21.10.2020 01:01
English, 21.10.2020 01:01


